Showing posts with label Statistics. Show all posts

Saturday, July 20, 2019

Statistics--Finding Mean, Median, Mode and Range with Your Name

Statistics is one of my favorite units to teach. It is something every person should understand. It is used against voters and consumers all the time and we should be able to recognize when the statistics aren't really saying what we're being told they are saying.

In a statistics class in college I had to read the book Damned Lies and Statistics. It was eye-opening to see how bad statistics can be used influence people.

I explain all of this to my students when I start our statistics unit. We only spend about 3 weeks on it, and its usually the end of the year, but its a unit students usually enjoy.

I wanted to share a freebie with you today. I gave this to students for homework. Students use their name, turn the letters into numbers, and then calculate the mean, median, mode, and range to their names.

Name Mean, Median, Mode and Range
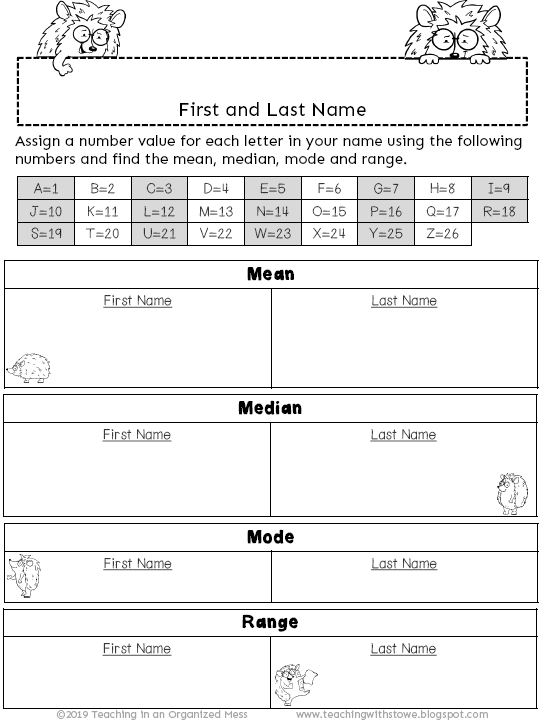

Students like it because it is their own name so it is a little less headache to get them to complete it. 


If you are interested in other statistics resources I have some in my store. 


**This site contains affiliate links to products. I may receive a commission for purchases made through these links.***

Saturday, April 2, 2016

Percent Bar Graph

We are right in the middle of our statistics unit. Yesterday we started percent bar graphs.

Here is what I found is the most important thing about bar graphs--use data the students connect to. For this categorical data, I collected it from the students. The day before I had them fill out a google form and for each class I used their data--and a few from the other classes to make it 25 different people. I asked basic questions--favorite color, # of letters in first name, # of pets, # of siblings, etc.

We started with taking these notes I came up with the morning of. I rarely have a full page of notes like this without any foldables/cloze notes for my students with accommodations--but I didn't have time to print something.

HOWEVER, notes like this make me EXTREMELY happy. They are so pretty. Early in my teaching career, I had students just write out notes and every time I would have them admire my/their work.


For the class percent bar graph, we graphed for "How many letters are in your first name?"

After we did it as a class, I gave groups the print out of the data I had collected. They had to choose one question and make a relative frequency table and a percent bar graph. Here are some examples:


The students to that data and tried to find which line was theirs and got so excited about it. Instead of just giving them random numbers to make a graph with, giving them something they can connect to has made the difference. Nobody complained about doing this--the only complaints I got was that they didn't get to help enough. 

Thursday, March 24, 2016

Measures of Center

We started our unit on Statistics after spring break. It is one of my favorite things to do and teach and it is not easy for students to understand. There are so many little things about that you understand once you've studied statistics for awhile. I took some pretty intense statistics classes in college, so I feel like everyone should learn everything about it--I have to remind myself that my 6th graders need to be gradually introduced to it.

So this is the foldable we created for Mean, Median, Mode, and Range--I let my students use my markers and they loved it--I'll have to pull out markers more often.


I read this book in college and it is so interesting. It's been a few years since I've read it, I might have to pull it out again.

Related Posts Plugin for WordPress, Blogger...